How to Read Your Child’s MAP Score Report
. Posted in BOSTON EXAM SCHOOLS, MAP
MAP (Measures of Academic Progress) is a computerized adaptive assessment that measures your child’s knowledge of reading and math. You will receive a score report for your child after they have taken the test. All students are asked the same number of questions, but the difficulty of each question is based on how well a student answers all the previous questions. As the student answers correctly, questions become more difficult. If the student answers incorrectly, the questions become easier and then become progressively more challenging. This enables the assessment to precisely identify the full spectrum of a student’s strengths and weaknesses.
Although the assessments are not timed, it usually takes students about one hour to complete each assessment. Students taking Primary MAP (first and second grade) usually take 20 to 30 minutes to complete each assessment. But how do you read the score report once you get it?
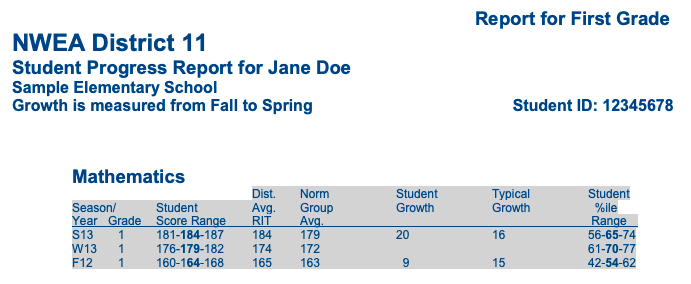
Here is an example score and breakdown of a MAP Score Report.
Mathematics Goal Performance
Operations and Algebraic Thinking: High
Number and Operations in Base Ten: HiAvg
Geometry, Data and Measurement: Avg
Season/Year: The season and the year the test was taken. F = fall; S = spring; W = winter.
Student Score Range: The bold print middle number is the RIT score your child received. The numbers on either side of the RIT score define the score range. If retested, your child would score within this range most of the time.
District Average RIT: The average score for all students in that grade level in our district who were tested at the same time as your child.
Norm Group Average: The average score observed for students who were in the same grade and tested in the same season (e.g., fall or spring).
Student Growth: Represents the growth in the RITs your child made from the fall to the spring of the year in which growth is reported.
Typical Growth: The average growth of students who were in the same grade and began the growth comparison period at a similar achievement level.
Student Percentile Range: The number in the middle is your child’s percentile rank – the percentage of students in the study that had a RIT score equal to your child’s score. The numbers on either side of the bold number define the percentile range. Percentiles are used to compare one student’s performance to that of a larger group. Percentile means the student scored as well as or better than that percent of students taking the test in that grade.
Goal Performance: Each area tested is listed along with a descriptive adjective of your child’s score. The descriptors are: Low (<21 percentile), LoAvg (21-40 percentile), Avg (41-60 percentile), HiAvg (61-80 percentile), High (>80 percentile).
Lexile Range: The difficulty range of text that can be understood by the student 75% of the time.

Reading Definitions
Foundational Skills: Indicates a student’s ability to apply print concepts, phonological awareness, phonics
and word recognitions skills.
Language and Writing: Indicates a student’s ability to apply language, grammar and usage skills as well as
understand how to capitalize, spell and punctuate accurately. Also indicates a student’s understanding of writing including purpose, planning, developing and editing.
Literature and Informational: Indicates a student’s ability to identify key ideas, details, craft and structure within informational text as well as key ideas and structure within literature.
Vocabulary and Functions: Indicates a student’s ability to use context clues and references in language as well as a student’s ability to use and acquire vocabulary.
Lexile Range: Lexile is a unit for measuring text difficulty that is linked to the RIT score. Books that fall within this range are considered to be appropriately challenging for your child. More information about the lexile measure can be found at www.lexile.com.
Mathematics Definitions
Operations and Algebraic Thinking: Indicates a student’s ability to represent and solve problems, and understand properties of operations.
Number and Operations: Indicates a student’s ability to understand place value, counting and cardinality; understand operations in base ten; and understand fractions.
Measurement and Data: Indicates a student’s ability to solve problems involving measurement, and represent
and interpret data.
Geometry: Indicates a student’s ability to reason with shapes and their attributes.
Need help preparing for the MAP exam? Click here to see what Boston Tutoring Services has to offer.
Allison Green
Boston Tutoring Services